When it comes to marketing your firm, you need to create content that your potential and current clients care about. You need to create content they want to read, view, download, etc.
The question is: How do you determine the type of content your clients want?
The answer: Use metrics gathered in Google Analytics.
Important Content Marketing Metrics
There are several important metrics in Google Analytics you should be checking out to help with your B2B content marketing efforts. These include average time on page, bounce rate, and goal conversions. Let’s take a quick look at each one to see what it’s saying about your content.
All Pages Report
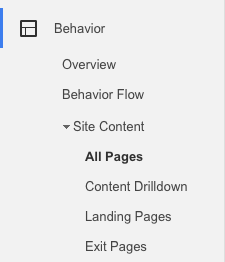
Start by checking out the All Pages report under Behavior.

In this report, you can see the pages that get the most traffic on your website. The report shows the number of page views, unique page views (unique visitors), average time on page, entrances, bounce rate, % exit rate, and page value.
In the All Pages report, you’ll see a good overall snapshot of the top visited pages for your website. This is a great place to see what blog posts, pages, and content pieces are getting the most traffic. If you are looking to see what topics interest your clients, this is the place to look.
Look at the number of page views each page receives. In the example below, the 4th most popular page is a blog post about statistics. The 10th most popular post also offers statistics. From this, we can gather that statistics are important to potential clients and is bringing a lot of traffic to the website.
In many cases, the information here can be a little surprising. You may think that your clients are interested in how a service benefits them when they are actually more interested in how to convince their boss they need your service (like statistics!).
Average Time on Page
After the number of page views, look at the average time on page and the bounce rate for each page.

In the example above, the blog on the look and feel of the website has an average time on page of over 7 minutes, however, the bounce rate is 92%. This means that visitors are engaging with the content and finding it useful but they leave the site immediately after reading it. From this, we can extrapolate that visitors to this particular blog aren’t the target audience.
![]()
In this next example here comparing a content piece in the content library and the client portfolio, we see the opposite. The portfolio page has a lower time on page but a very low bounce rate – which means the visitors are checking out more pages on the website. Visitors to the portfolio page are likely the target audience.
While the first example shows a high average time on page and the second has a low bounce rate, you want a good mix of the two. You want to create content that people are actually reading (the blog on the look and feel of a website) and you also want to create content that will nurture clients down the sales funnel (portfolio).
Conversions Report
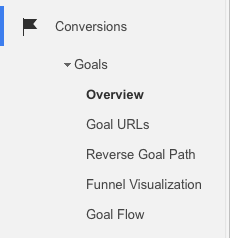
The next report you can check in Google Analytics is the Goal Conversions report. A large part of any content marketing strategy is to track conversions. For example, if your website has case studies, white papers, ebooks, request consultation forms, contact forms, etc, you should be tracking all of those important conversions.

Specifically, for a B2B content marketing strategy, it’s important to see how the content pieces that you’ve created are performing. If you set up goal tracking in Analytics, this is a snap. From this report, you can see how many conversions each content piece received for a specific time period. The number of conversions tells what types of content are popular and what are unpopular. Ideally, you want to create more popular content and stop spending time on content that is unpopular.
That’s the gist of these two reports in Google Analytics and how they can help you track and improve your content marketing strategy. Have questions about how to maximize your content marketing strategy? Let us know in the comments.


